Where do the weeks go… no seriously! Because I am writing this and it’s already September! I’ll give you the three month report for April, May & June. But I’ll throw in a little bit extra with a look into the next quarter too.
Numbers are on the rise (isn’t it good when you can see your hard work pay off!)
Remember too… Event Scene is a South Australian business. These numbers are ONLY for South Australian venues. 63% of the users visiting the site are local to Adelaide South Australia. They are local’s looking for their next function venue, whether its for high end private dining, a meeting room, private function room for a cocktail party, or a group booking to celebrate in a restaurant. These are all Adelaide customers browsing Event Scene.
Have a look at the testimonials from other venues.
These numbers are the overview. If you have a listing, you’ll also be sent statistics showing the number of enquiries you have received and the number of page views for your venue.
ACQUISITION
Organic Search: 69.9%
This is excellent as it shows we are still strong on the first page of google. This is how you capture the attention of clients that wouldn’t have otherwise thought to book with you.
PAGE VIEWS: 27,635
AVERAGE PAGES PER SESSION: 6.92
Customers are spending time browsing to select their venue. So the enquiries you are getting are high value… after looking at a number of venues, they have chosen to contact you.
SESSIONS: 3,991
AVG SESSION DURATION: 3mins 22 secs
BOUNCE RATE: 9.40%
Bounce rate means the number of people who come to the website and then leave without going to a second page. This is low meaning customers have come to the right place to find their venue.
So how many enquiries are going through to the venues?
In the three month period reviewed:
1026 links out
119 enquiry forms
Links customers linking through to your website to enquire directly with you.
Enquiry forms are forms sent from your listing page directly to your inbox.
We have seen a long time trend of customers preferring to contact the business directly through their own website. That is why we still have the website link available and track this as an enquiry.
For individual venues the top performers are:
TOP FEATURED VENUE:
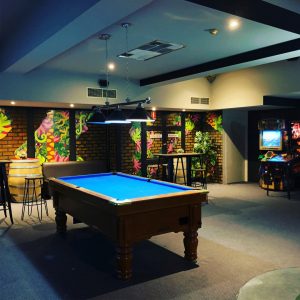
Basement Bar took out the top over the three month period with the most page views and most links/enquiries. Electra House was very close on their tail… This is interesting as they are two VERY different venues.

TOP STANDARD LISTING VENUE:
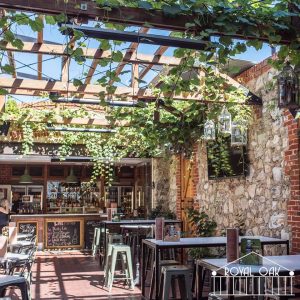
The Royal Oak took out the top for the most page views and links/enquiries. And OAR, a beautiful new cafe at West Lakes was very close behind. It’s great to see that it’s not just venues in the Adelaide CBD that are getting attention for function bookings.

So, looking into the future…
ORGANIC SEARCH:
April – June: 69.9%
July: 75.6%
August: 73.9%
PAGE VIEWS: April – June: 27,635
Average per month April – June: 9,211
July: 10,448
August: 14,247
AVERAGE PAGES PER SESSION:
April – June: 6.92
July: 6.44
August: 6.22
SESSIONS: April – June: 3,991
Average per month April – June: 1330
July: 1623
August: 2,290
AVG SESSION DURATION:
April – June: 3mins 22 secs
July: 3.10
August: 3.19
BOUNCE RATE:
April – June: 9.40%
July: 3.94%
August: 4.89
LINKS & ENQUIRIES
LINKS OUT: April – June: 1026 links out, Average per month: 342
ENQUIRY FORMS: 119 enquiry forms, Average per month: 39
LINKS OUT JULY: 447
LINKS OUT AUGUST: 541
ENQUIRY FORMS JULY: 44
ENQUIRY FORMS AUGUST: 86
If you are thinking about advertising your venue for functions, we would love to hear from you.
A listing comes with a guarantee that you will see an excellent return on investment.
